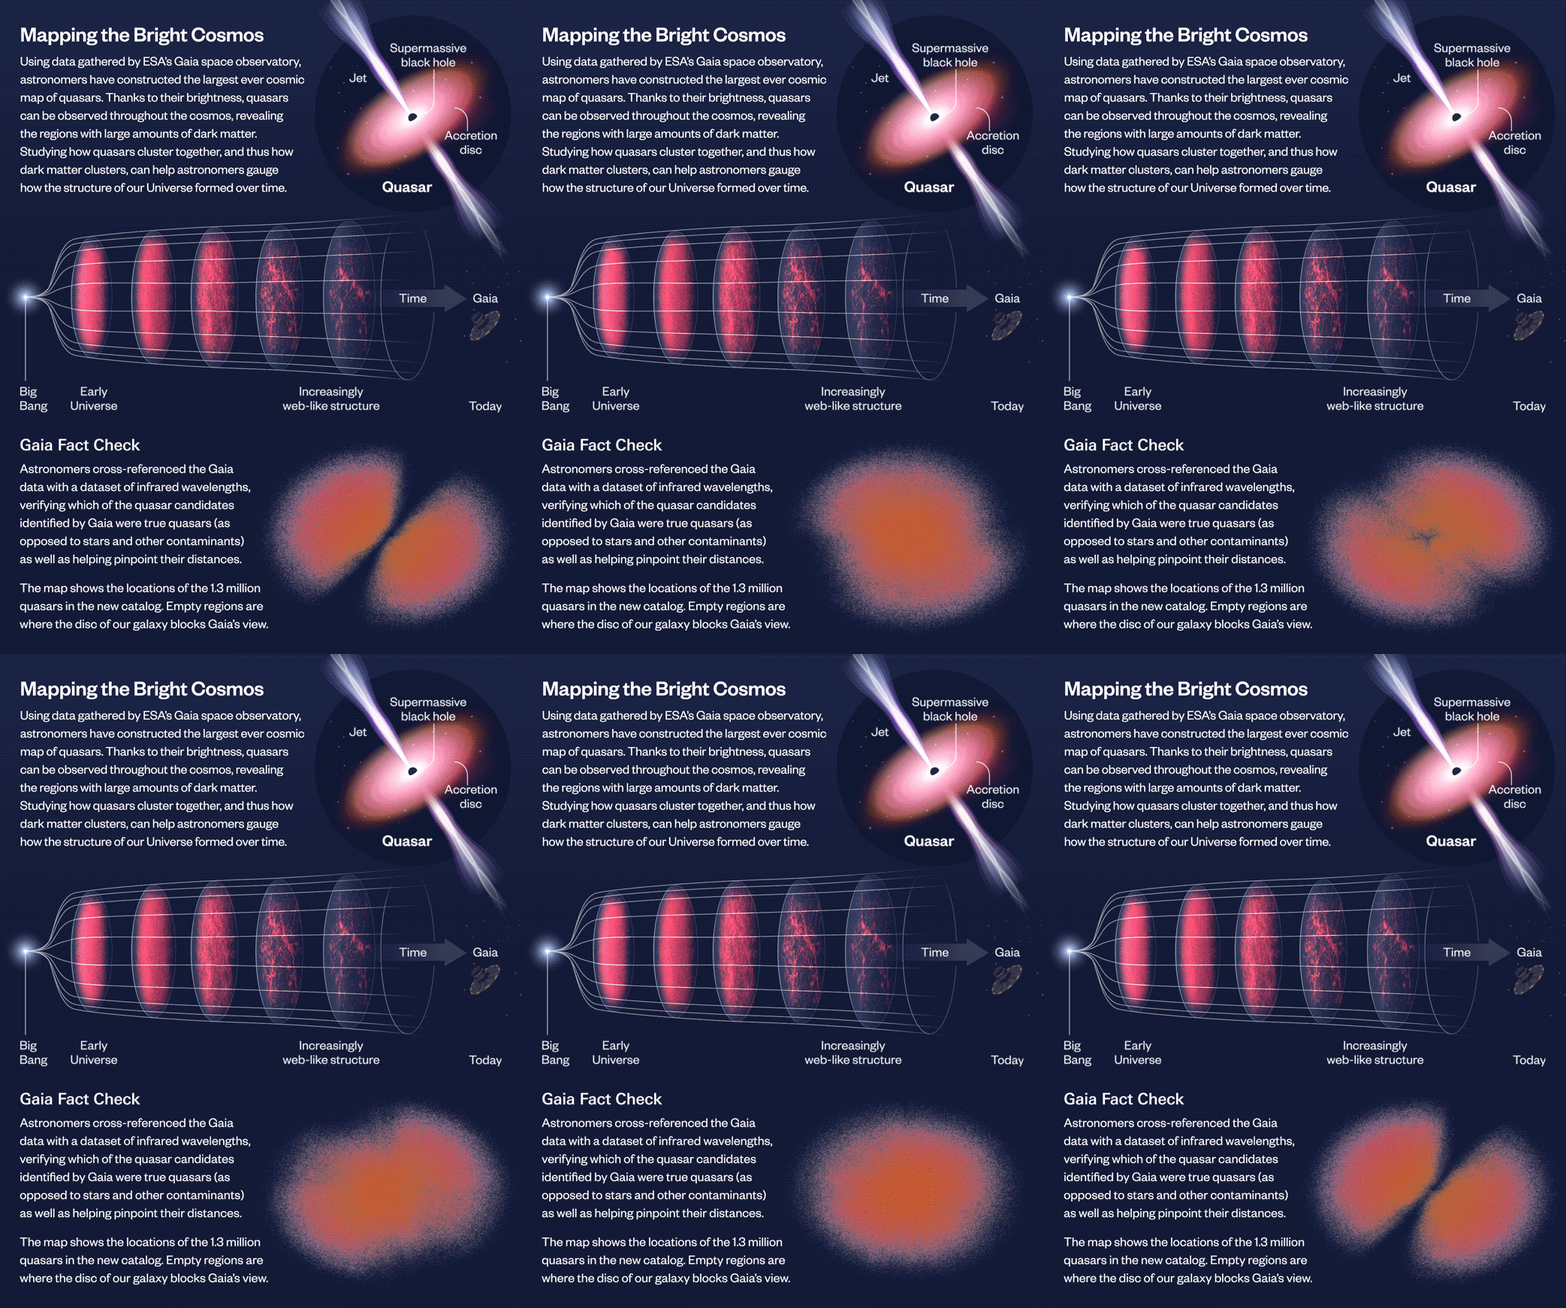
Astronomers have created the largest yet cosmic 3D map of quasars: bright and active centres of galaxies powered by supermassive black holes. This map shows the location of about 1.3 million quasars in space and time, with the furthest shining bright when the Universe was only 1.5 billion years old.
The new map has been made with data from ESA’s Gaia space telescope. While Gaia’s main objective is to map the stars in our own galaxy, in the process of scanning the sky it also spots objects outside the Milky Way, such as quasars and other galaxies.
The graphic representation of the map (bottom right on the infographic) shows us the location of quasars from our vantage point, the centre of the sphere. The regions empty of quasars are where the disc of our galaxy blocks our view.
Quasars are powered by supermassive black holes at the centre of galaxies and can be hundreds of times as bright as an entire galaxy. As the black hole’s gravitational pull spins up nearby gas, the process generates an extremely bright disk, and sometimes jets of light, that telescopes can observe.
The galaxies that quasars live in sit inside massive clouds of invisible dark matter. The distribution of dark matter gives insight into how much dark matter there is in the Universe, and how strong it clusters. Astronomers compare these measurements across cosmic time to test our current model of the Universe’s composition and evolution.
Because quasars are so bright, astronomers use them to map out the dark matter in the very distant Universe, and fill in the timeline of how the cosmos evolved.
For example, scientists have already compared the new quasar map with the cosmic microwave background, a snapshot of the oldest light in our cosmos. As this light travels to us, it is bent by the intervening web of dark matter – the same web mapped out by the quasars – and by comparing the two, scientists can measure how strongly matter clumps together through time.
This map was made by Kate Storey-Fisher of the Donostia International Physics Center in Spain and the New York University, USA, and colleagues, and published in the Astrophysical Journal. It uses data from Gaia’s third data release, which contained 6.6 million quasar candidates, as well as data from NASA’s Wide-Field Infrared Survey Explorer (WISE) and the Sloan Digital Sky Survey (SDSS). Combining the datasets helped clean Gaia’s original dataset of contaminants such as stars and galaxies, and better pinpoint the distances to the quasars. The team also created a map of where dust, stars and other phenomena are expected to block our view of some quasars, which is critical for interpreting the quasar map.

